In the plotly.github.io repo, tutorials are written as individual .md files. These files are organized into sub-folders (by subject) inside the /_post folder.
To create a new tutorial, generate a new .md file in the appropriate folder for the tutorial (i.e. if the tutorial is ‘Box-plots in Chart Studio’ add your .md file to the statistical folder).
Ensure that the title of the .md file includes the date (date created): yyyy-mm-dd-title-of-tutorial.md. Thus:
/_posts/statistical/
---2018-07-26-how-to-create-a-box-plot.md
These are the variables defined at the top of each post:
tutorial-single_layout or additional options listed hereA tutorial on how to --insert tutorial subject-- --insert Plotly Tool (i.e. in Chart Studio)--.fundamentals | basic | statistical | scientific | maps | graph3d | layout | subplot | textandlinks | analysis
Determines which section to place the tutorial in: http://help.plot.ly/tutorials/. This variable is used in the templatesstate: active |
inactive (if active, will appear on table of contents page). |
For example, here is the front matter for the boxplot tutorial:
layout: tutorial-single_layout
title: Box Plots in Plotly 2.0
subtitle: A convenient way of graphically depicting groups of numerical data through their quartiles.
meta_description: A tutorial on how to make a box plot in Plotly 2.0.
permalink: /make-a-box-plot/
imageurl:  https://plotly.github.io/static/images/how-to-make-a-boxplot/thum-how-to-make-a-boxplot.png
state: active
tags: statistical
order: 2.5
actioncall: How to Make a Box Plot in Plotly 2.0
actioncall-url: https://plot.ly/alpha/workspace/?fid=plotly2_demo:108
live-graph: <iframe width="900" height="800" frameborder="0" scrolling="no" src="https://plot.ly/~plotly2_demo/108.embed"></iframe>
otherlang: Know how to program? See how to create this in [Python](https://plot.ly/python/box-plots/) or [R](https://plot.ly/r/box-plots/).
Content is placed immediately under the front matter in steps. Here, content is divided into sections with - title and sub-steps. Depending the tutorial you’re writing, try to remain consistent with the sub-step layout. For example, for a chart tutorial you would use something like:
Within each sub-step you can use - copy to define the text and img for the images / screenshots. It is important to note that text and images must exist inside quotations. Furthermore, use alt tags in images img: "".
Here is a snippet of the content for the boxplot tutorial:
steps:
- title: Try an Example
sub-steps:
- copy: "Box plots may have lines extending vertically from the boxes, or whiskers, indicating variability outside the upper and lower quartiles. This type of plot is also known as a box-and-whisker plot or box-and-whisker diagram."
- copy: "After selecting 'Box plot' under 'Chart Type', you can check out an example before adding your own data. Clicking the 'try an example' button will show what a sample chart looks like after adding data and playing with the style. You'll also see what values and style attributes were selected for this specific chart, as well as the end result."
img: ""
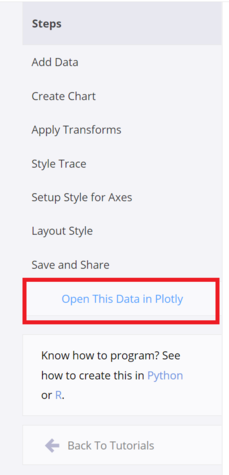
- copy: "You can also use the data featured in this tutorial by clicking on 'Open This Data in Plotly' on the left-hand side. It'll open in your workspace."
img: ""
- title: Add Your Data to Plotly
sub-steps:
- copy: "Head to Plotly’s new online [workspace](https://plot.ly/create/box-plot/) and add your data. You have the option of typing directly in the grid, uploading your file, or entering a URL of an online dataset. Plotly accepts .xls, .xlsx, or .csv files. For more information on how to enter your data, see [this](http://help.plot.ly/add-data-to-the-plotly-grid/) tutorial."
img: ""
Where possible add images (screenshots) and gifs to tutorials to supplement instruction text. For each tutorial create a folder in /static/images/<chart-tutorial-name> i.e. /static/images/box-plot. Here, add each image with a descriptive filename (up to 5 or 6 words) such as static/images/box-plot/add-trace.png instead of something generic like static/images/box-plot/img1.png. An example of an images folder would be:
/static/images/box-plot/
---add-trace.png
---color-trace.png
---style-plot-background.png
---add-annotations.png
Ready for your changes to be reviewed? Make a pull request against master!
Create a feature branch and use git status to list changed files.
git checkout -b your_feature_branch
git status
Add, commit, and push the files that you’d like to add to your PR:
git add file-a
git add file-b
git commit -m 'message about your changes'
git push origin your_feature_branch
Visit the plotly.github.io repo and open a pull request against master. You can then tag @cldougl and @bcdunbar for a review.
Once you’ve merged your changes check them online.