Axes Properties
A Guide to Axes Properties with Chart Studio
Introduction
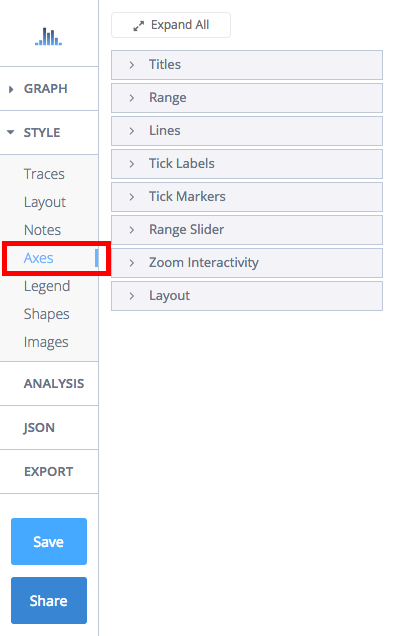
Most graphs consist of a horizontal axis (x-axis) and a vertical axis (y-axis) to display their data. This tutorial will show you different ways you can define axes properties. All the attributes in this tutorial are found in the online workspace in the 'Axes' section, under STYLE."
Change Axis Range
You can set the range of your axes in the 'Range' sub-tab.
The axes are autoscaled, but if you want you to change the range of your axes, click 'Custom Range' under 'Selection'.
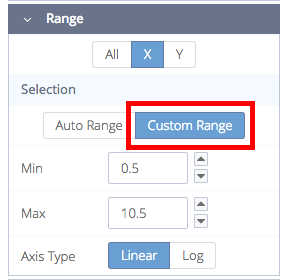
For our example, our y-axis values are over 15 so we'd like our y-axis to start at 10 (our minimum value). We'll click on 'Y' and then enter the minimum value in the 'Min' field. This can be done if we have a maximum value, by entering it in the 'Max' field.
Reverse Axis
Reversing the axis is so easy; just flip the 'Min' and 'Max' values. The animated image below shows that when we switch the 'Min' and 'Max' values, the axis is reversed.
Log Axis
You can also set the axis type as linear or log. In the 'Range' sub-tab, select the desired axis, then click 'Linear' or 'Log' under 'Axis Type'.
Tick Labels
Customizing the style and number of tick labels along the axes can help highlight particular aspects of your data.
The tick labels reflect column values that were selected in your trace(s).
You have the option of showing these labels or hiding them. Go to 'Axes', then 'Tick Labels' and depending on the axis you want to change, select X, Y, or 'ALL'. The default is 'SHOW' but click 'Hide' if you don't wish to display them.
Tick Text
When the tick labels are set to 'Show', you can change their typeface, font size and font color. Note that certain colors and typefaces are only available with a PRO subscription. Click here to upgrade!
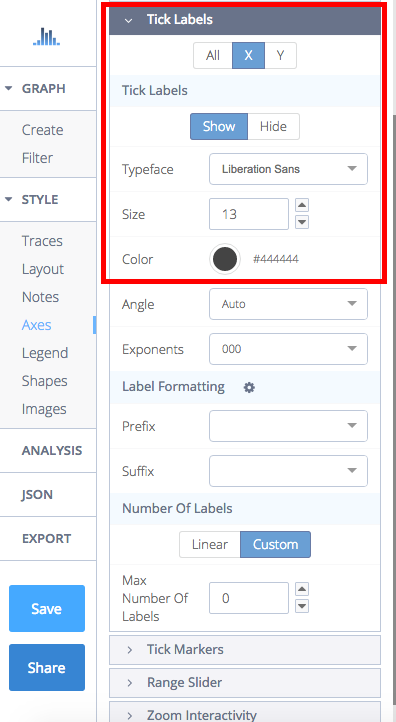
The ticks can be angled at 45°, 90°, 135°, or 180°. You can also add exponents, but it'll only work if your axes consist of numerical data.
You can add a prefix or suffix to your tick labels. If yours isn't listed, click on 'Custom' and type it in the field.
For our example, our y-axis consists of data in Celcius, and our x-axis is in minutes. 'Minutes' isn't listed, so we'll select 'Custom' and type it in.
Once you've selected or entered a prefix or suffix, click the icon next to 'Label Positioning'.
A modal will open with a few selections. You can place the prefix or suffix for the first or last tick label, all ticks, or none.
Customize Number of Tick Markers
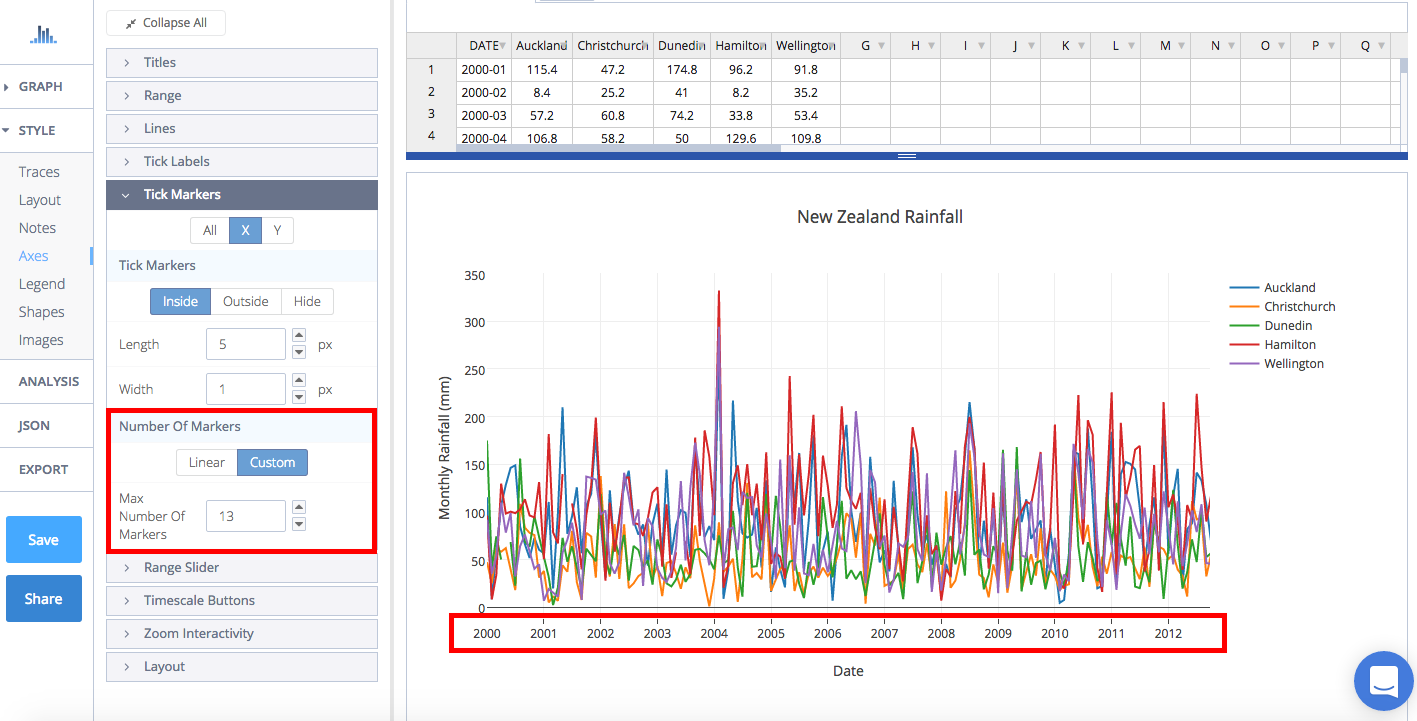
To set the number of ticks, go to 'Axes', and select the number from either 'Tick Labels' or 'Tick Markers'. The markers are hidden under 'Tick Markers' by default, so click 'Inside or 'Outside' to view the options. You can set them as 'Linear' or 'Custom' in the same section.
The plot below had the dates on the x-axis set as biannual. We'd like to show every consecutive year, so we select 'Custom' and enter the desired number of markers in the field.
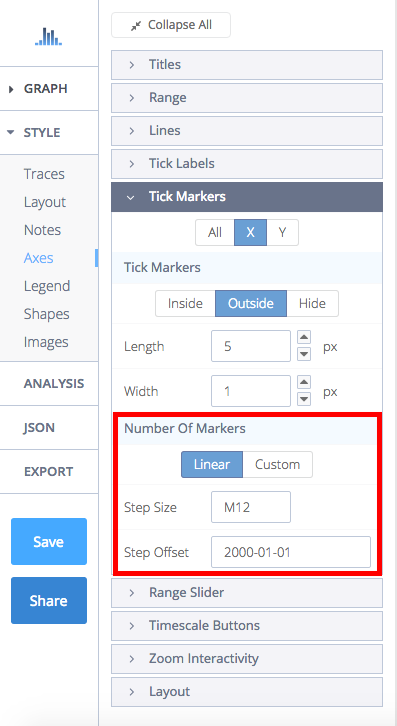
When you work with date or time series plots, you have to convert the date for the step size and set offset. Let's say you set ticks on the 15th of every third month, set the 'Step Size' to '2000-01-15' and 'Step Offset' to 'M3'. To set ticks every 4 years, set it to 'M48'. Our plot display our data every year, so it's been set to 'M12'. For more information, visit this page.
Axis Width
Your axis width can be adjusted by going to 'Axes', then Layout'. Use the arrows to adjust the start and end position, or type the percentage in the empty field.
Axis Positioning
The axis can also be repositioned and anchored. The x-axis can stay at the bottom or be moved to the top, and the y-axis can be moved to the left or right. If left 'Unanchored', they can be positioned vertically or horizontally by adjusting the percentage.