Make a 3D Surface Plot Online with Chart Studio and Excel
3D Surface Plots with Chart Studio
Upload your Excel data to Chart Studio's grid
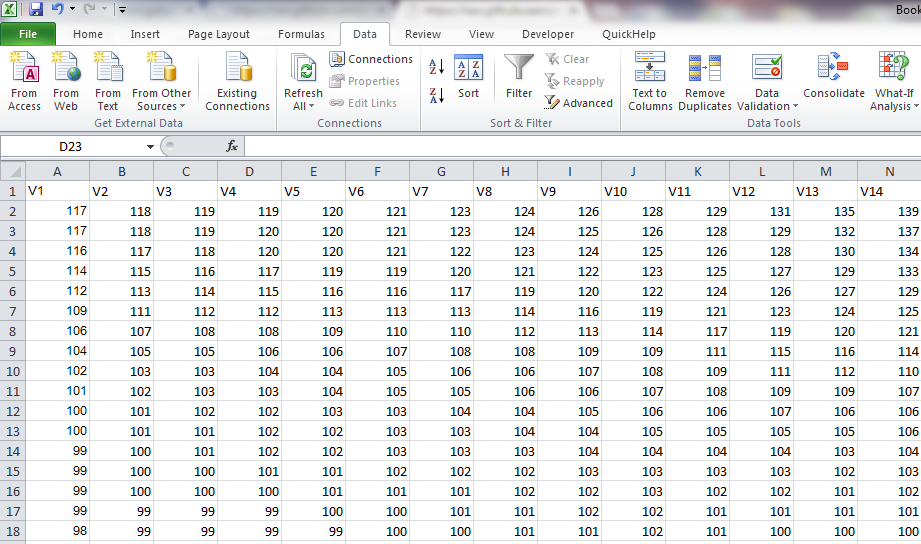
Open the data file for this tutorial in Excel. You can download the file here in CSV format
Head to Chart Studio
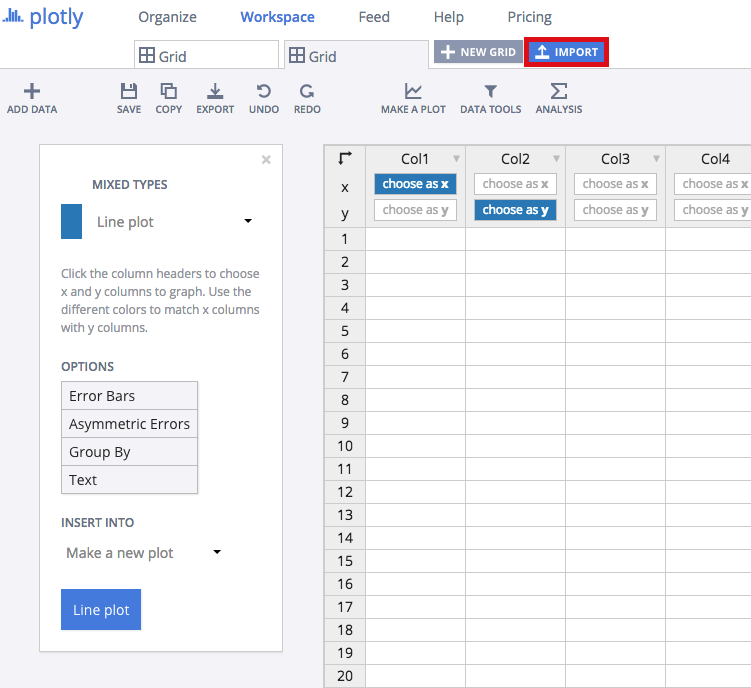
Head to the Chart Studio Workspace and sign into your free Chart Studio account. Go to 'Import', click 'Upload a file', then choose your Excel file to upload. Your Excel file will now open in Chart Studio's grid. For more about Chart Studio's grid, see this tutorial
Creating the Surface Plot
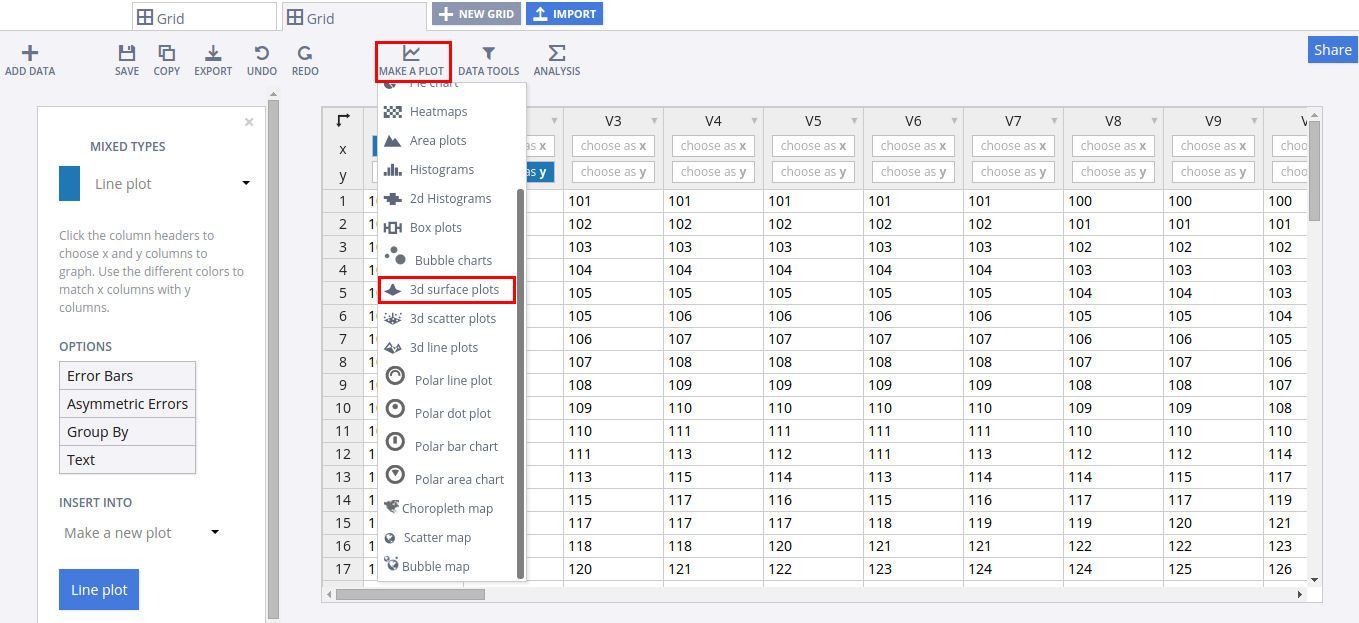
Select '3D Surface Plot' from the MAKE A PLOT button on menu bar.
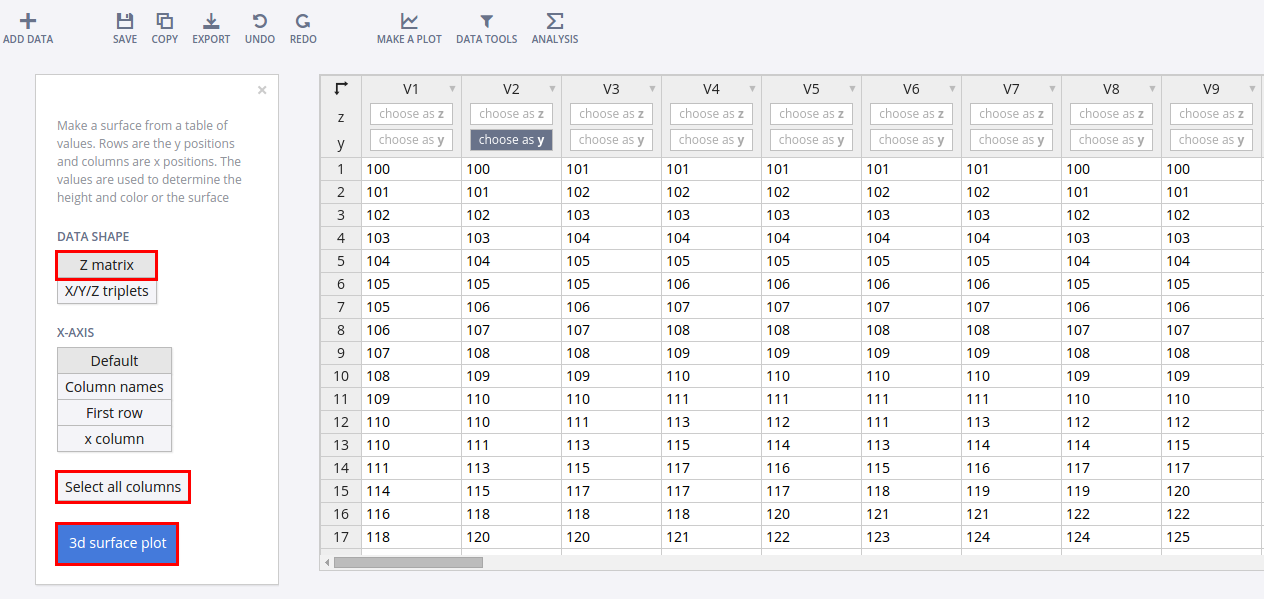
Choose the input shape as 'Z Matrix', click on 'Select All Columns Button'. With these options enabled, click the plot button to create the chart
Finalizing the chart
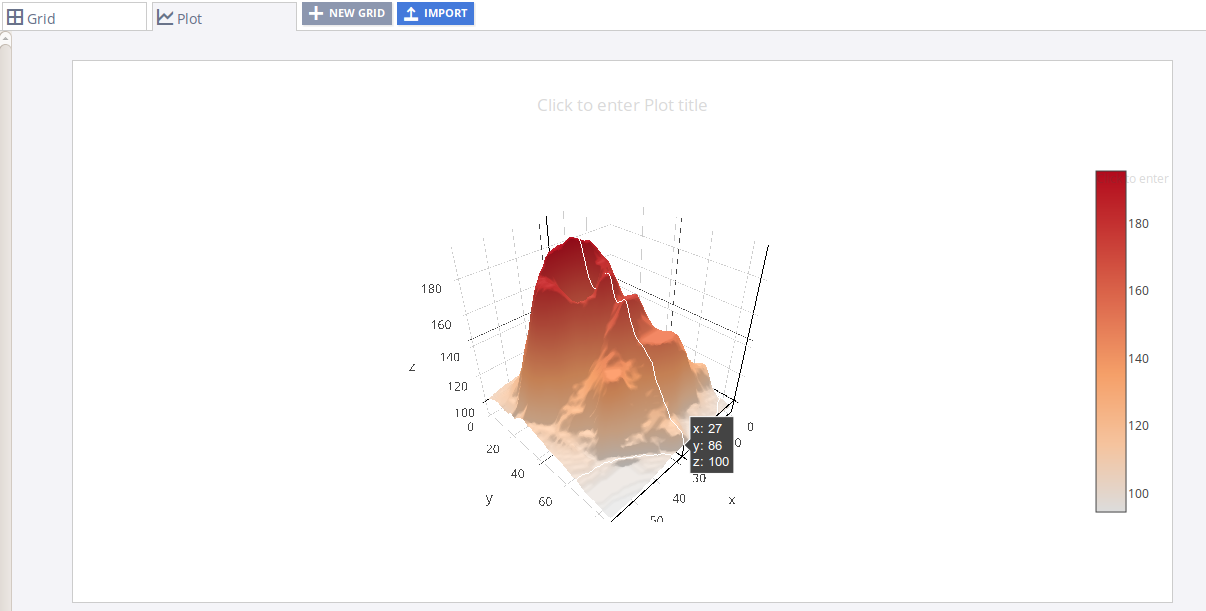
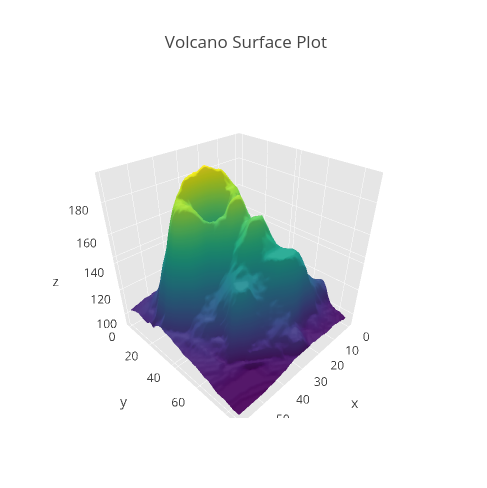
Your plot should look something like this:
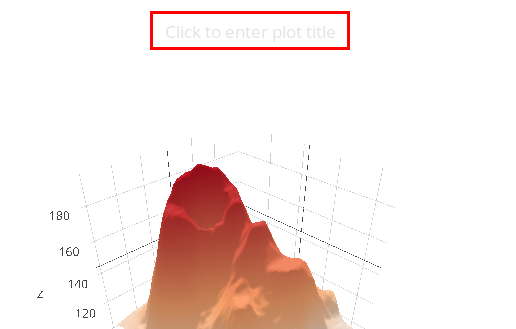
Now we will add some style elements to the generated plot. First, let's give it a name. We can add a title by clicking on the text box just above the plot:
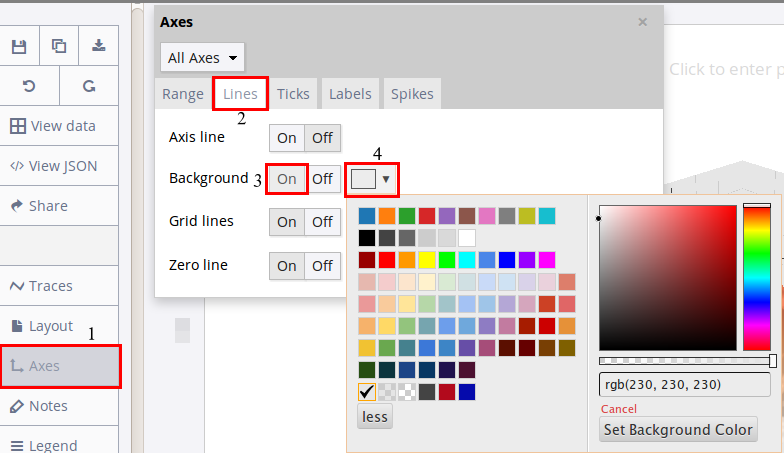
Styling options are present on the left side of the plot. To set the background color, (1) Click on the 'Axis' selector on the toolbar, (2) Click on the 'Lines' tab from the pop-up, (3) Set 'Background' to 'On', and (4) Select background color from the color pallete.
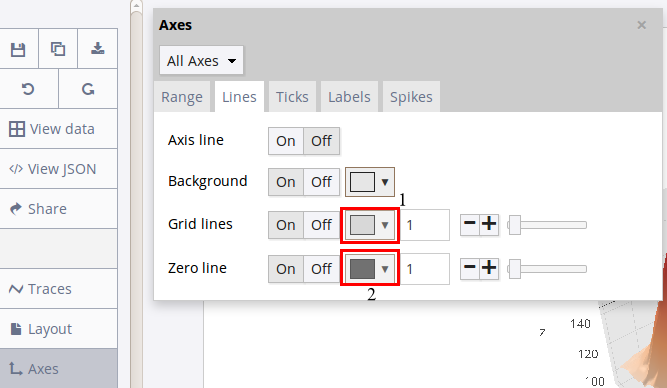
Axes and Grid: Go to 'Lines' tab from 'Axis' popover. (1) Set Grid Lines to 'On' and select white color from pop-up, (2) Set Zero Lines to 'On' and select white color from pop-up
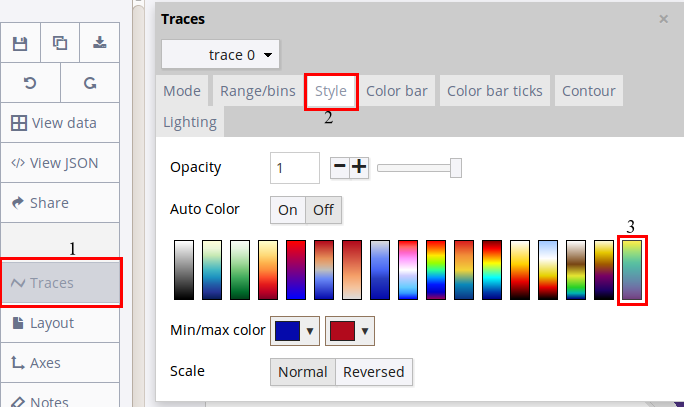
Change Color Scale:Chart Studio allows us to set among a wide range of colorscales.To change the color scale of a plot, (1) Click on the 'Traces' popover from the toolbar, (2) Click on 'Style' tab from the pop-up, (3) Turn Auto Color to 'Off', and set one of the color-scales.
Exporting the final chart
The final plot should look something like this:
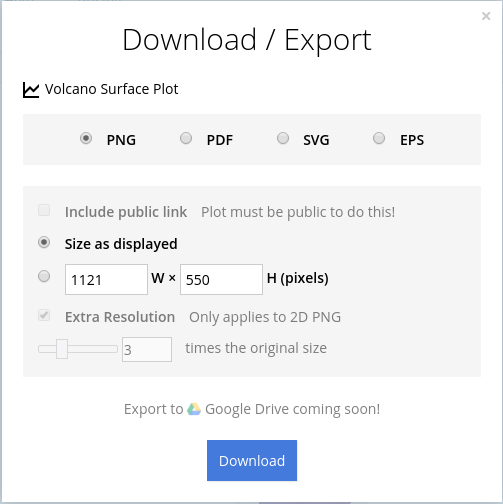
You can export the finished plot to embed in the excel notebook. We also recommend adding the Chart Studio link to the excel for easy access to the interactive version. To get the link to the chart, click on the 'Share' button. To export the chart, as an image, click on 'EXPORT' button on the toolbar.
To add the Excel file to your workbook, click where you want to insert the picture inside Excel. On the INSERT tab inside Excel, click PICTURE. Locate the Chart Studio graph image that you downloaded and then double-click it:

