Add a Logo in Chart Studio
How to add a logo to your plots.
Add an Image
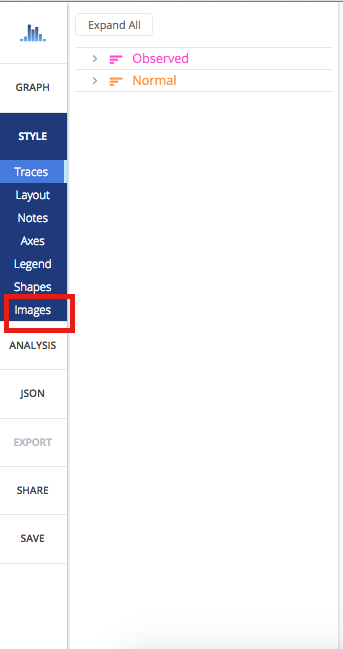
Click on STYLE and then the 'Images' tab at the bottom.
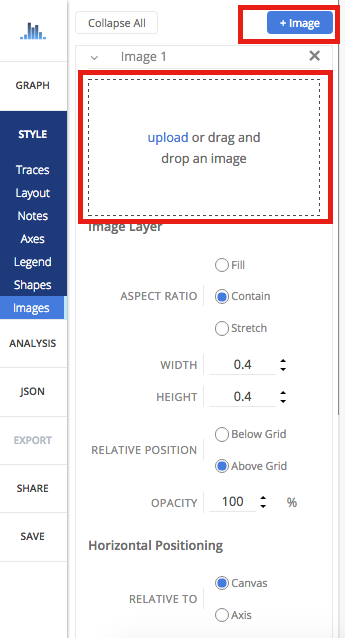
Once that panel opens, click on the blue '+ Image' button at the top right-hand side. This is where you upload or drag and drop your image.
Resize an Image
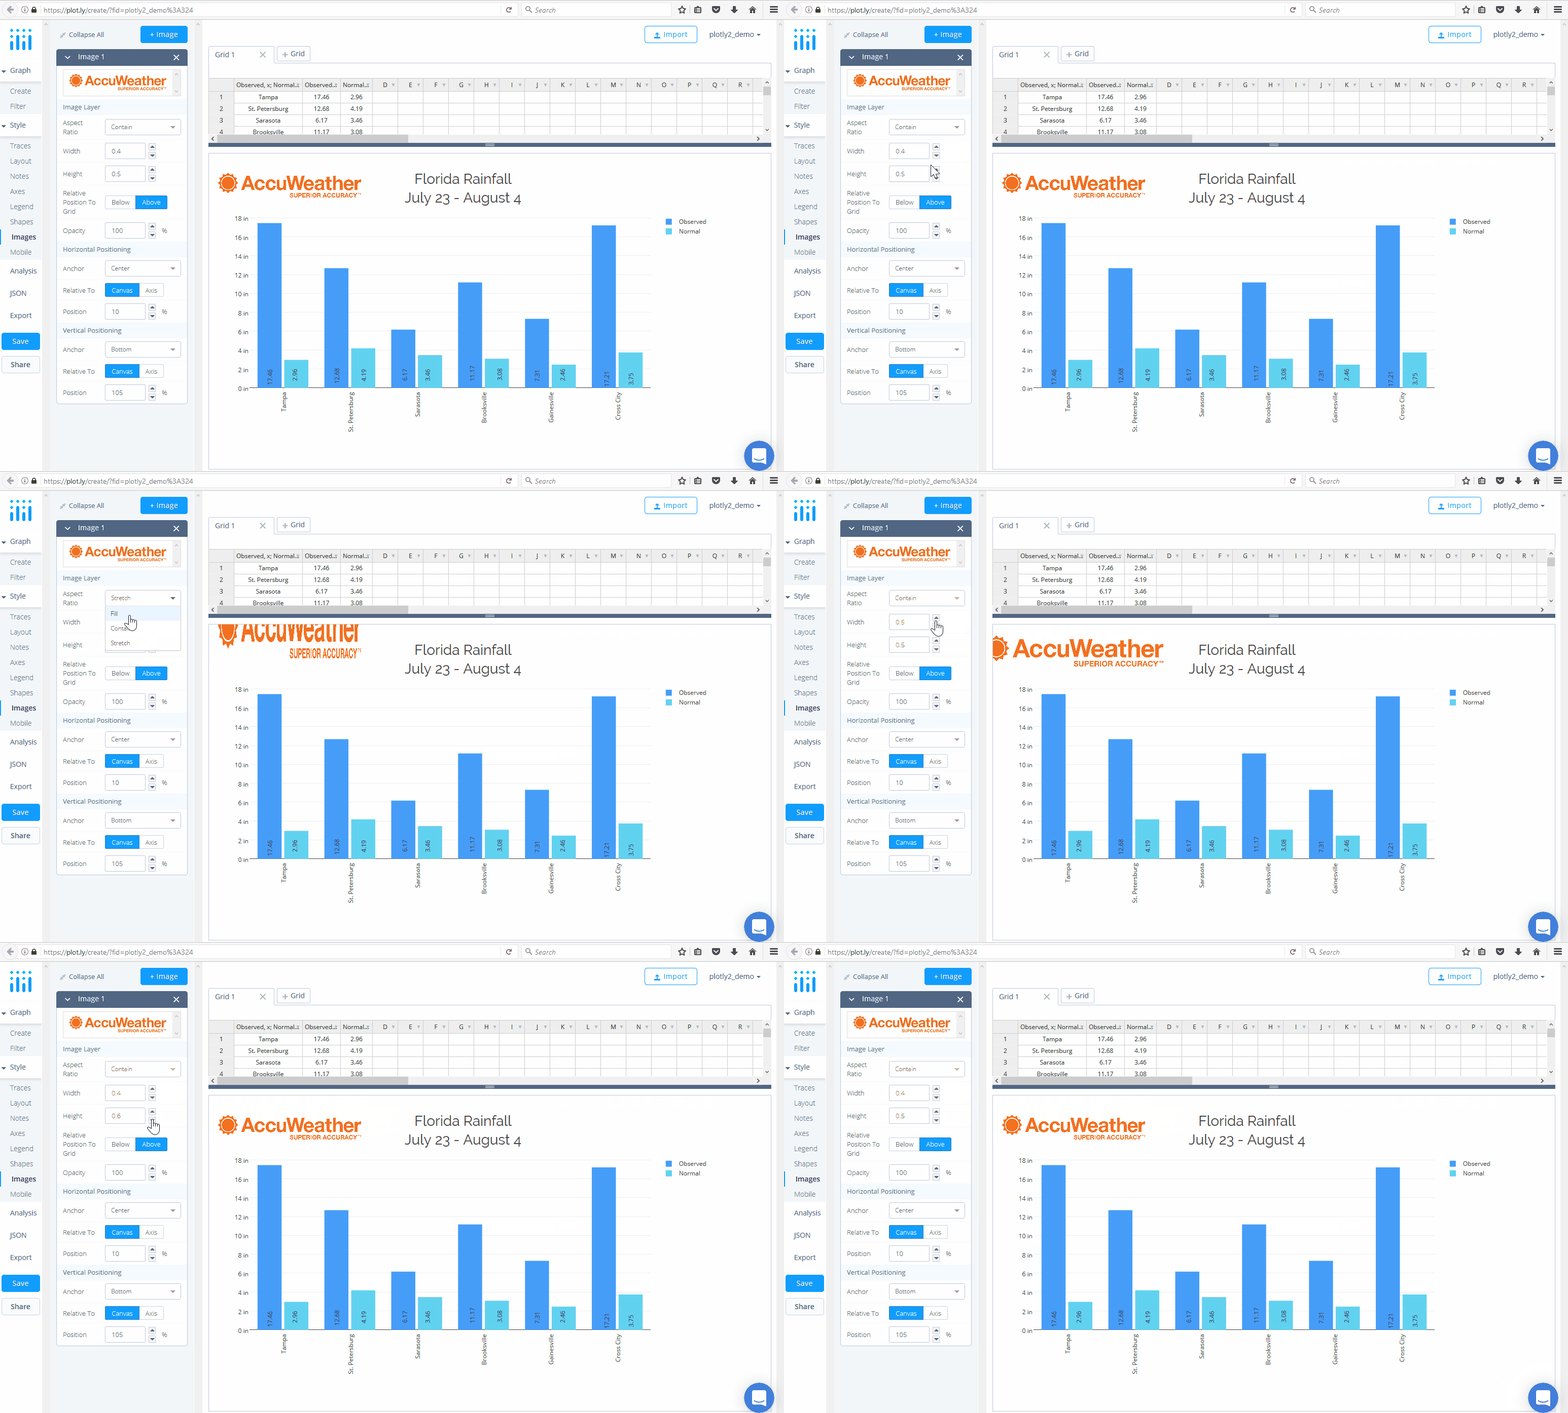
Your image will appear on the plot. You can resize the image by keeping the dimensions as is and selecting 'Contain', or choosing to 'Stretch' it. There's also the possibility of changing the width and height of the image.
Position an Image
You can move your image below or above the grid by selecting your preference next to RELATIVE POSITION. 'Below the grid' means the image will hide behind it, depending where you vertically anchor the image. You can also change the opacity of the image, and for this plot we have it at 100%. Depending on your background colour, if you place the image behind the grid, you won't see it until changing the background opacity.
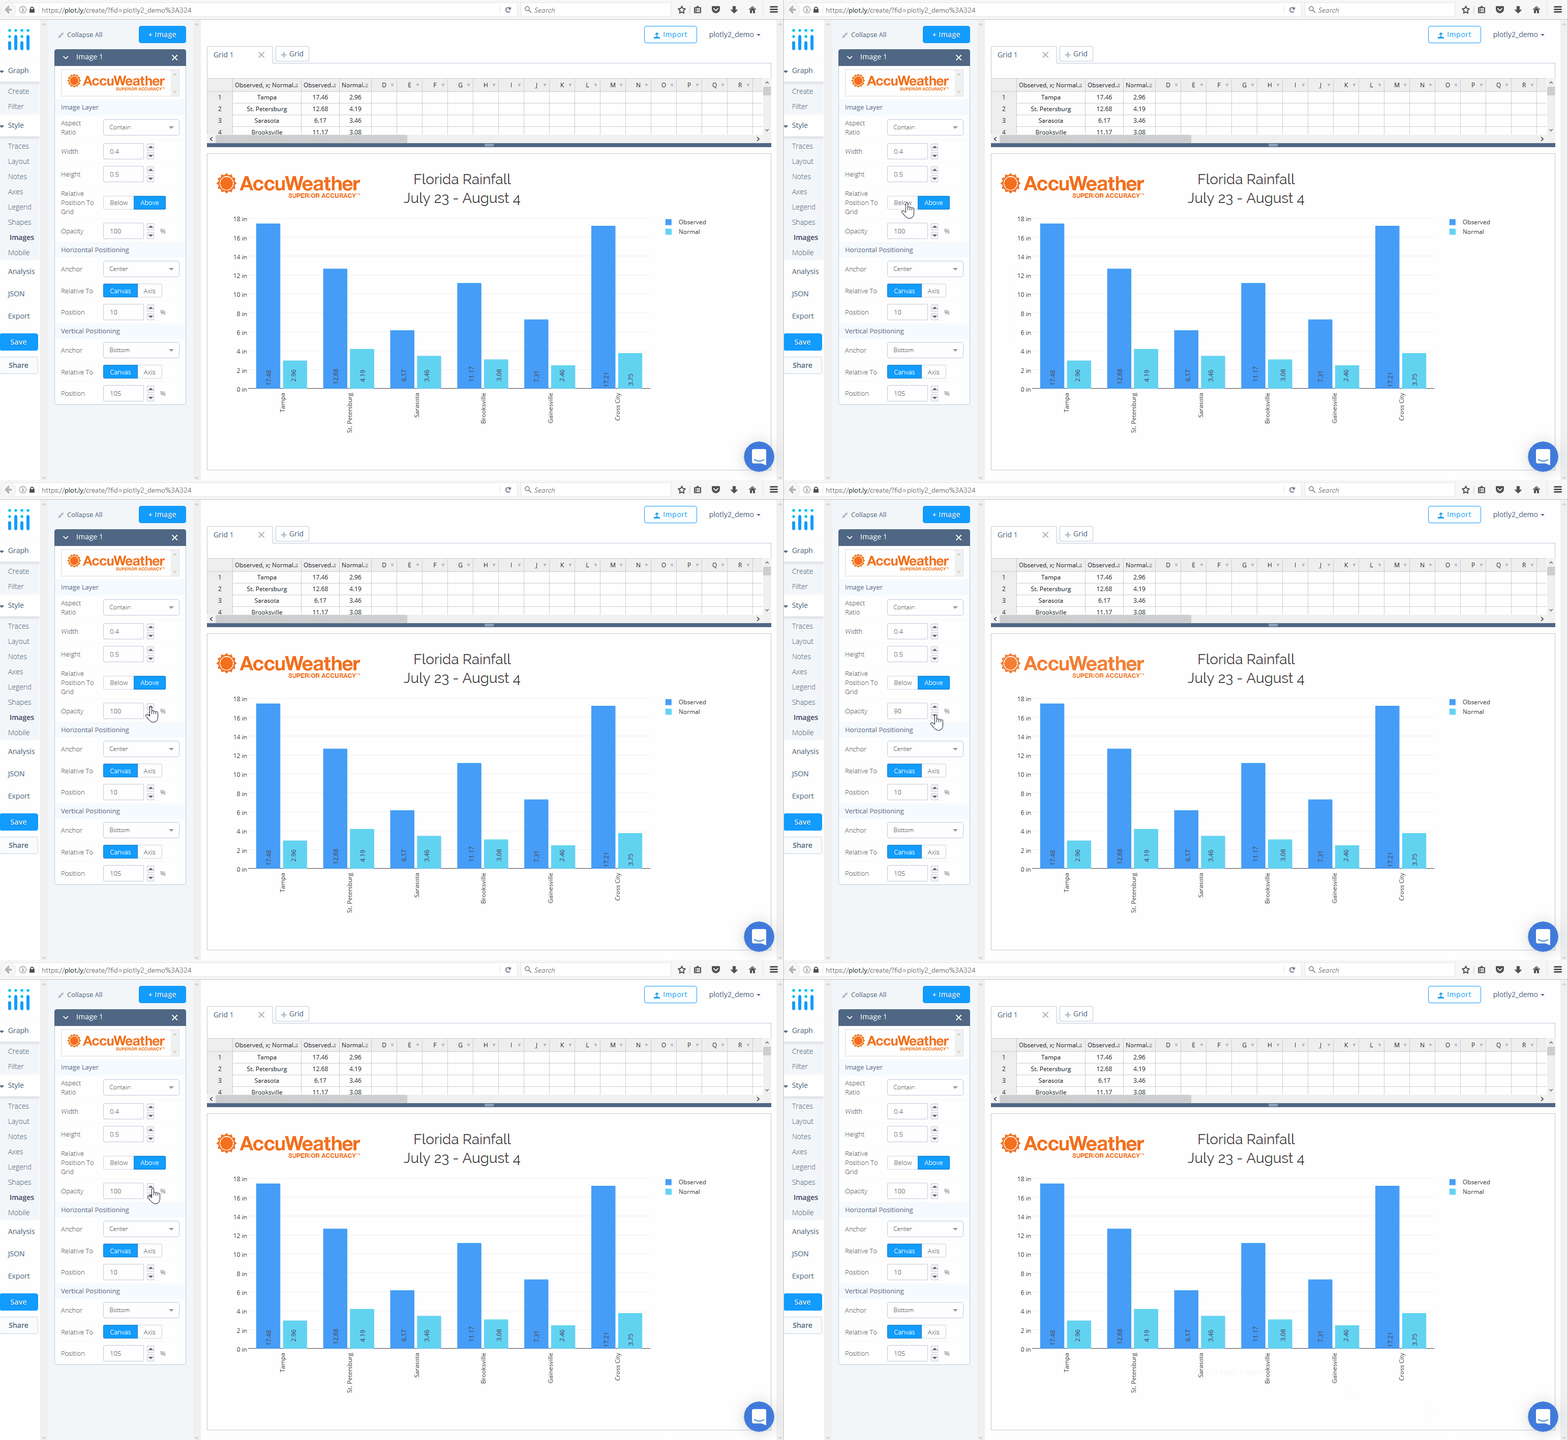
Your image can be positioned horizontally relative to the canvas or axis, the canvas being the section of your plot within the margins. It can then be anchored to the right, center, or left of your canvas or axis.
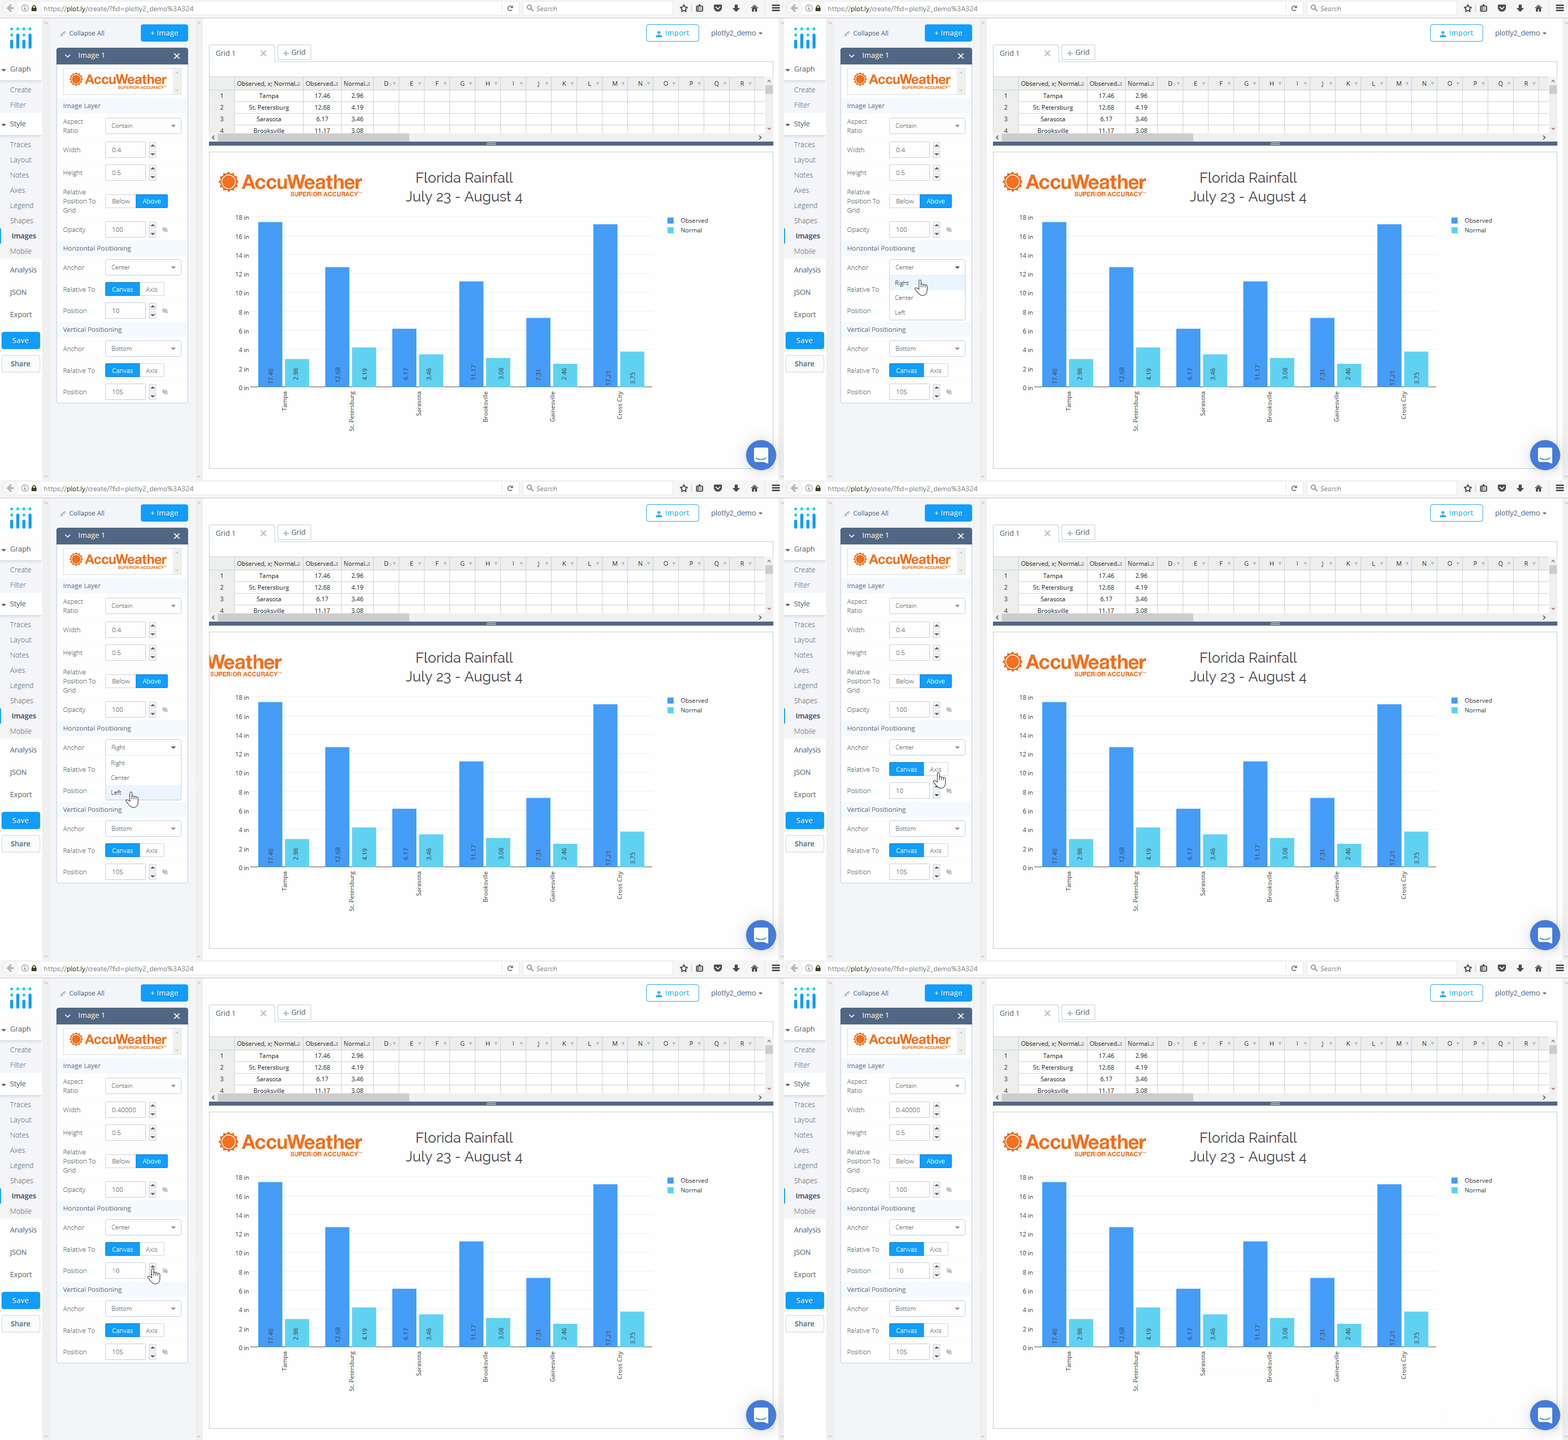
Next is the vertical anchor. Just like the horizontal positioning, you choose whether you want the image to be positioned relative to the canvas or axis, and anchored at the bottom, middle, or top.
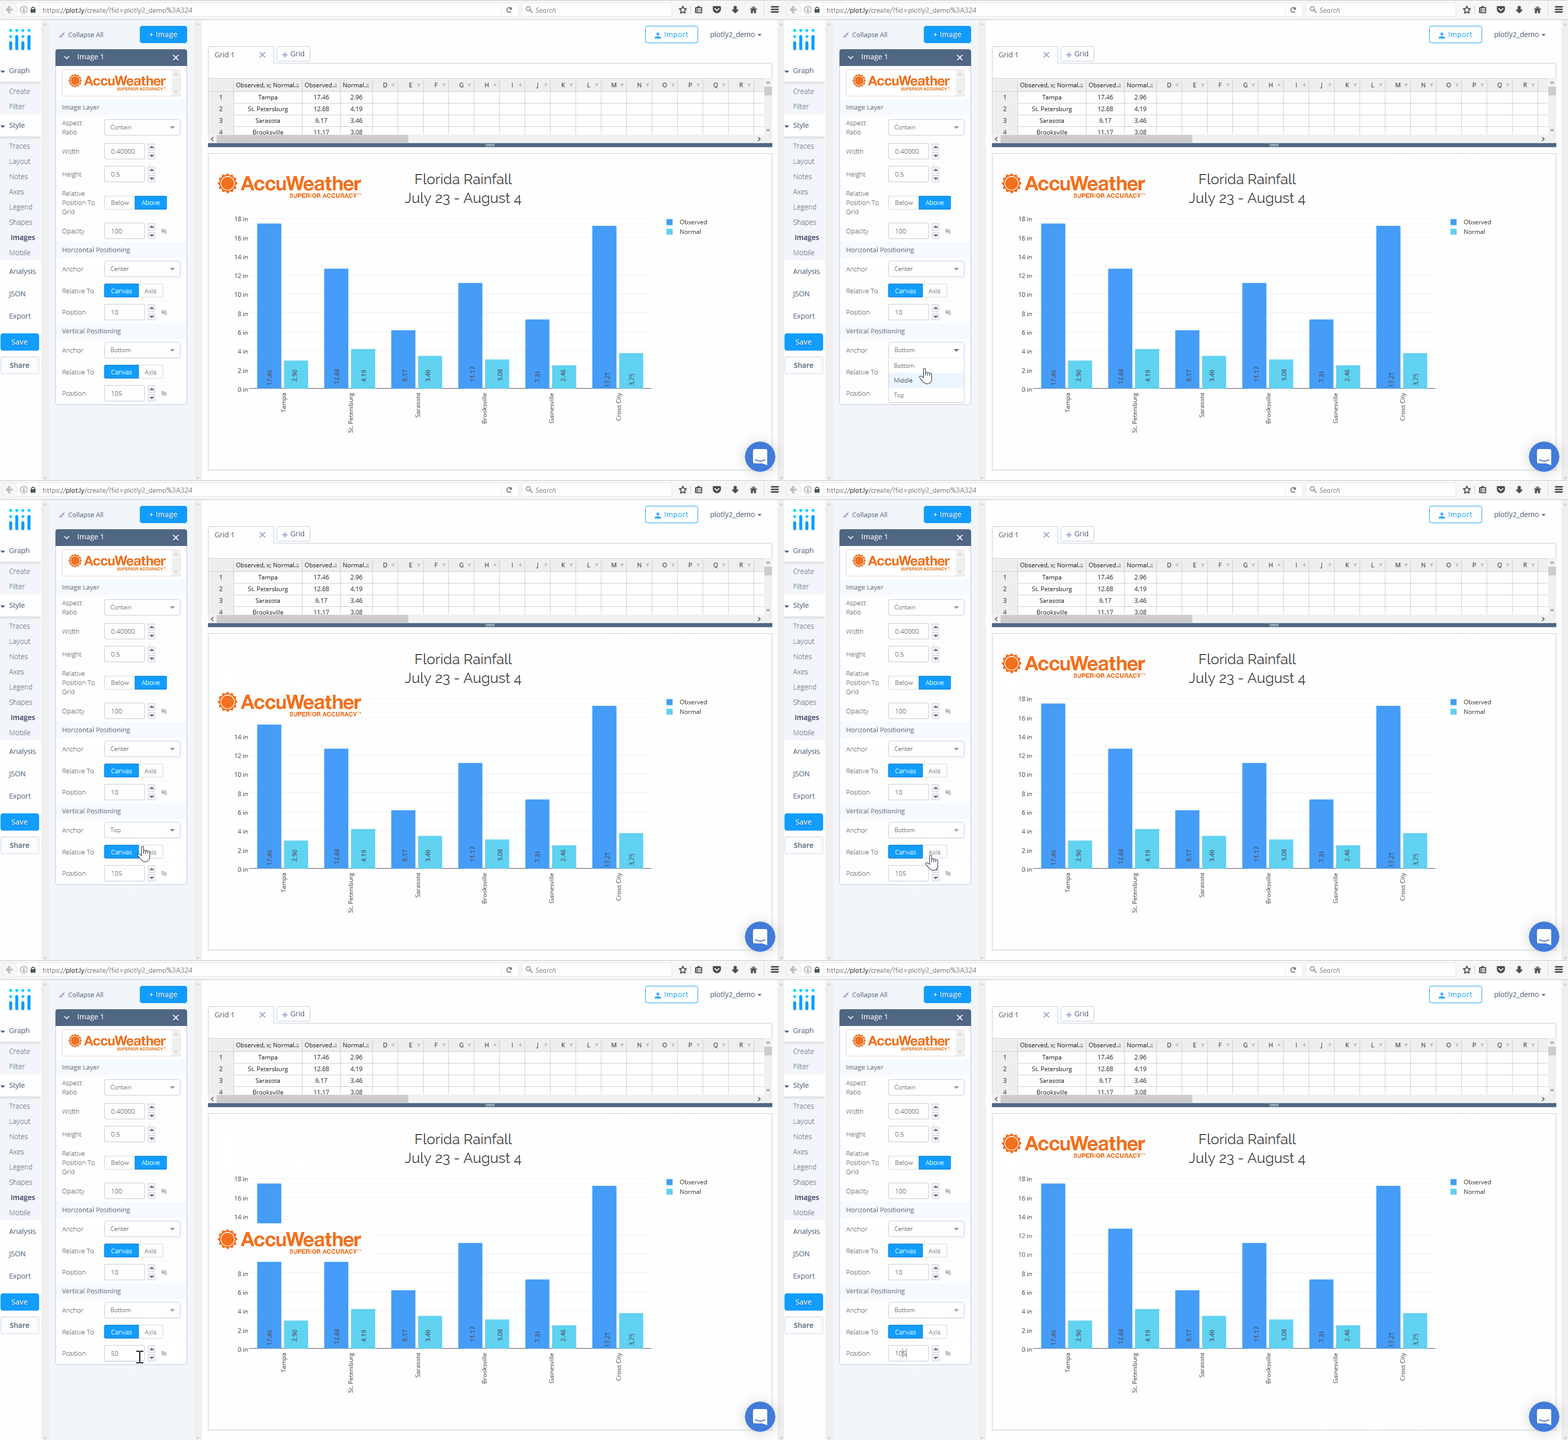
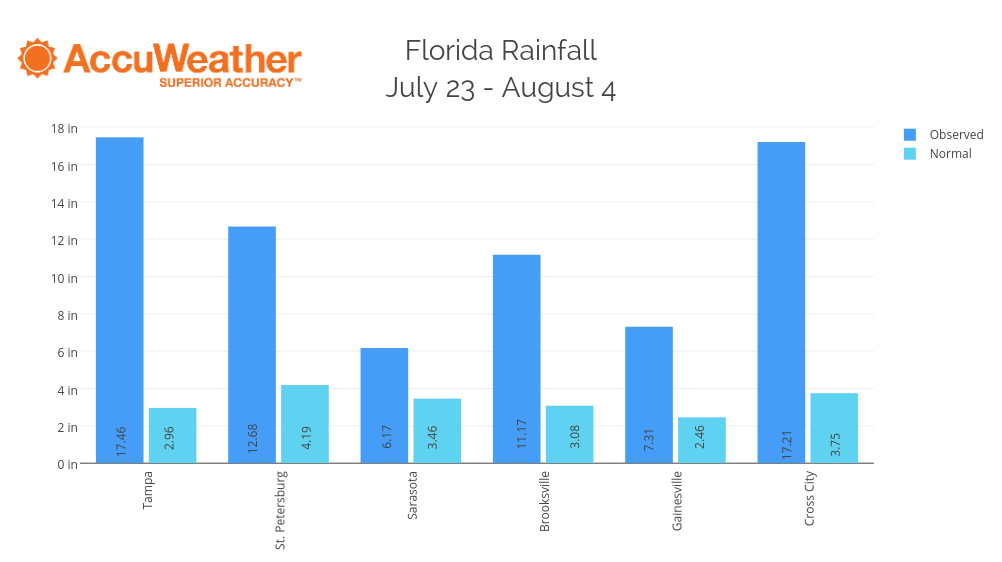
Here's the end result with the logo added to our plot, just the way we want it to appear!
