Chart Studio and Mapbox
Configure Chart Studio to work with Mapbox Atlas
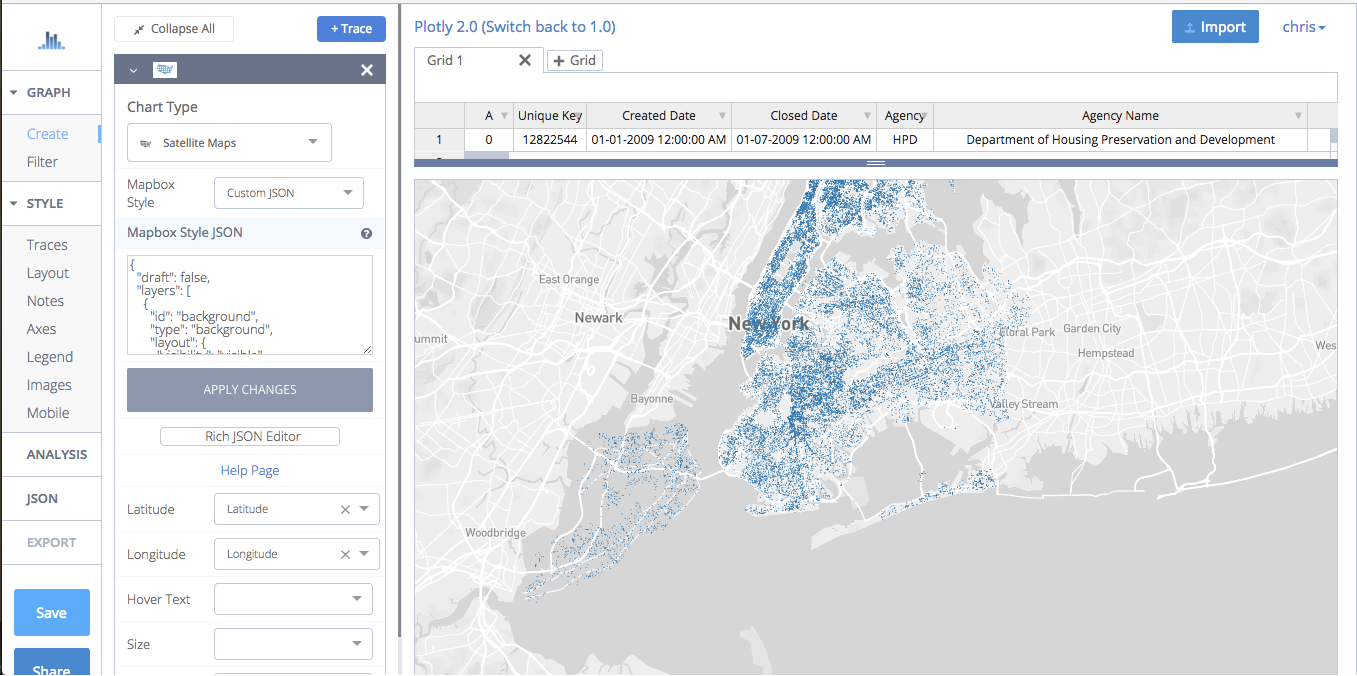
Chart Studio can create interactive satellite maps with Mapbox.
These map visualizations are interactive! Scroll or double-click to zoom, click-and-drag to pan, hover over points to see their values.
By default, these maps are downloaded from the public Mapbox API. If you are using Chart Studio On-Premise you will need to license an account from Mapbox Studio or license a private Mapbox Atlas server.
Configuring Chart Studio with Mapbox Atlas
Connecting Mapbox Atlas to Chart Studio is currently a beta feature. If you would like to run these products together, please reach out to our support team. You will need to configure your Mapbox Atlas server and your Chart Studio On-Premise with custom settings.
Mapbox Atlas server is licensed and installed separately from Chart Studio On-Premise.
Step 1. Configure Mapbox Atlas to serve vector tilesets for MapboxGL
Configuring Mapbox Atlas to serve vector tilesets is a Beta feature by Mapbox and does not come configured out of the box in Mapbox Atlas.
Please reach out to our support or sales team or Mapbox’s support team to learn more about how to configure vector tilesets.
Step 2. Test Vector Tiles Endpoint
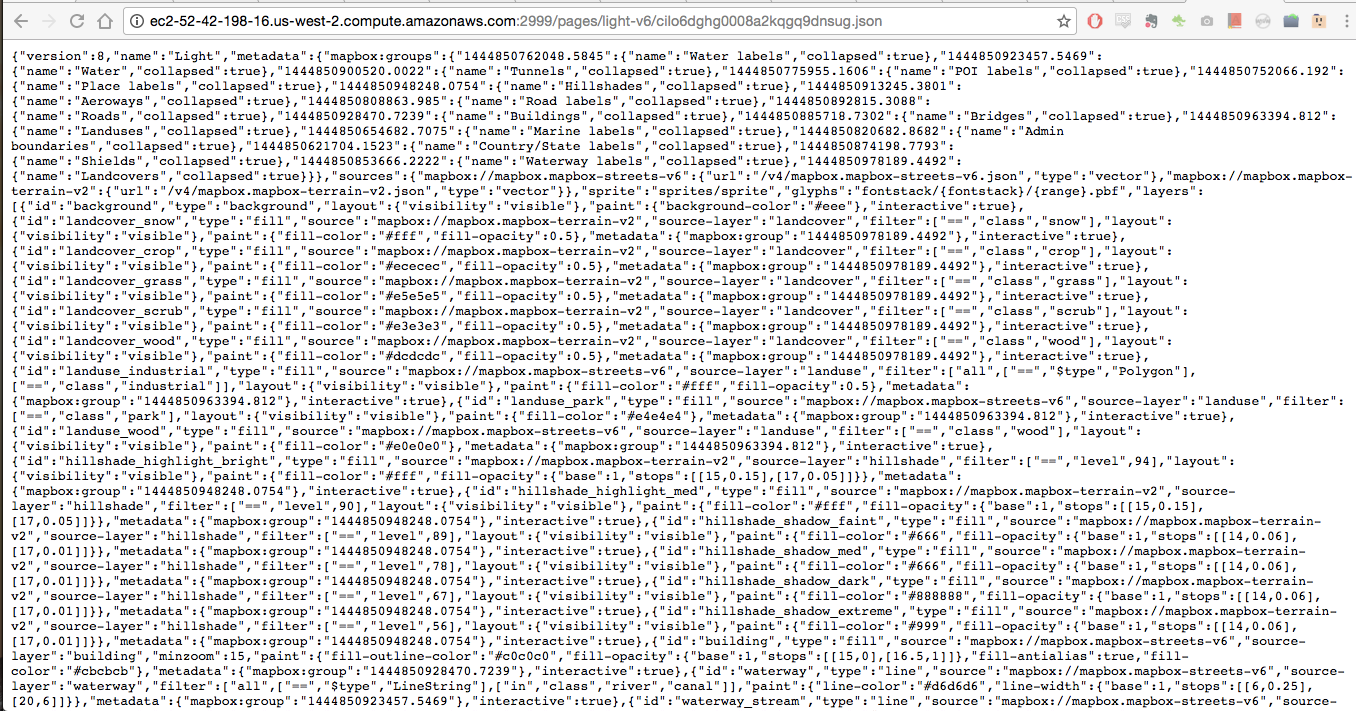
Once you have setup your Mapbox Atlas server to serve vector tiles, test the following “Mabpox Atlas Vector Tile URL” in your browser: https://your-atlas-domain:2999/pages/light-v6/cilo6dghg0008a2kqgq9dnsug.json (replacing your-atlas-domain with your mapbox atlas domain e.g. ec2-52-45-198-16.us-west-2.compute.amazonaws.com:2999/pages/light-v6/cilo6dghg0008a2kqgq9dnsug.json).
Note: depending on the instructions that your Mapbox representative has given you, the light-v6 and the cilo6dghg0008a2kqgq9dnsug.json components of the Mapbox Atlas vector tile may differ.
A JSON file should load:
Step 3. Configure the Mapbox Atlas Settings of Chart Studio On-Premise
Navigate to your On-Premise settings at your-plotly-domain:8800/settings and scroll down to the Mapbox section.
Enter “ATLAS” as the Mapbox Default Access Token and the URL https://your-atlas-domain:2999/pages/light-v6/cilo6dghg0008a2kqgq9dnsug.json as the Mapbox Atlas Default Style URL.
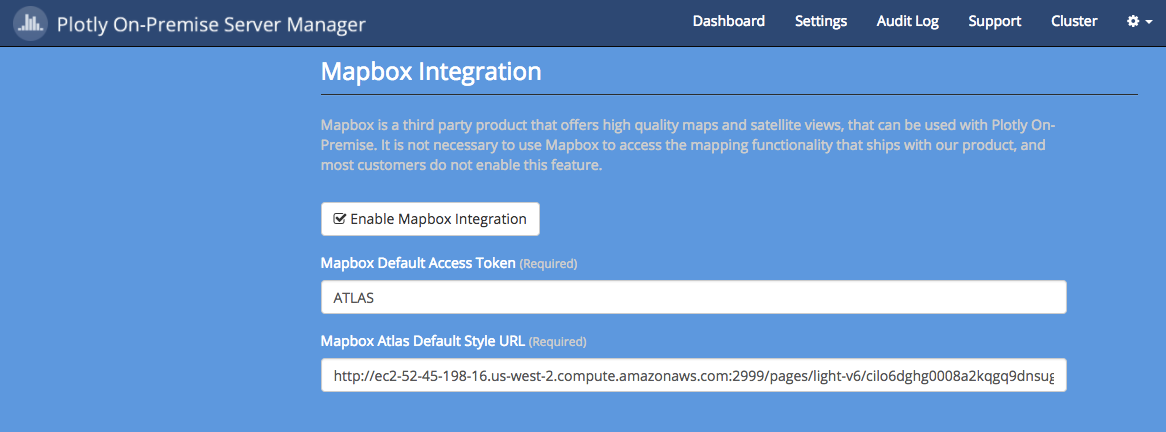
Save your settings and restart your server.
Step 4. Create a Chart with Mapbox Atlas
Visit the plotly chart creator at https://your-plotly-domain.com/create.
Select a “Satellite” map.
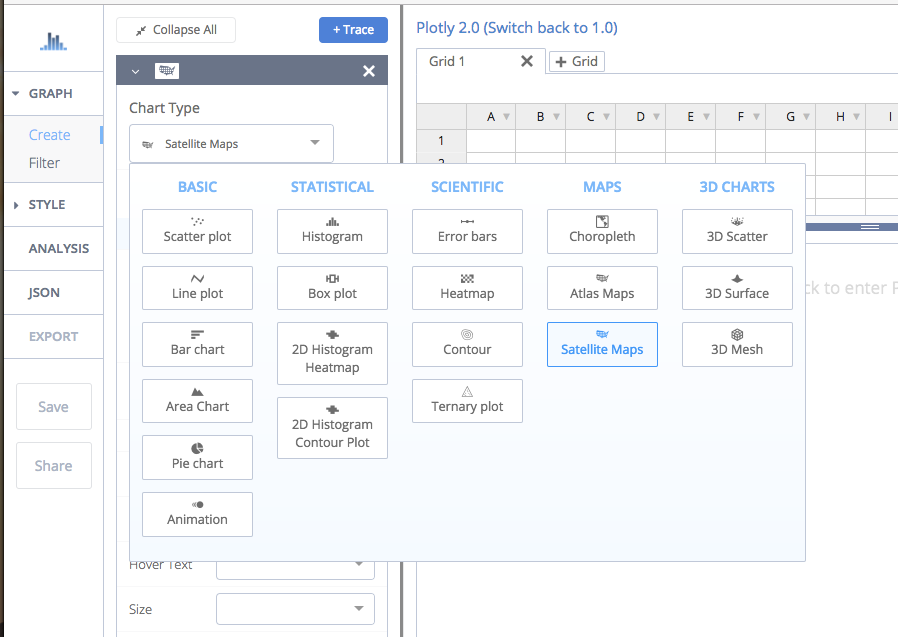
The Mapbox Atlas URL that you configured should appear.
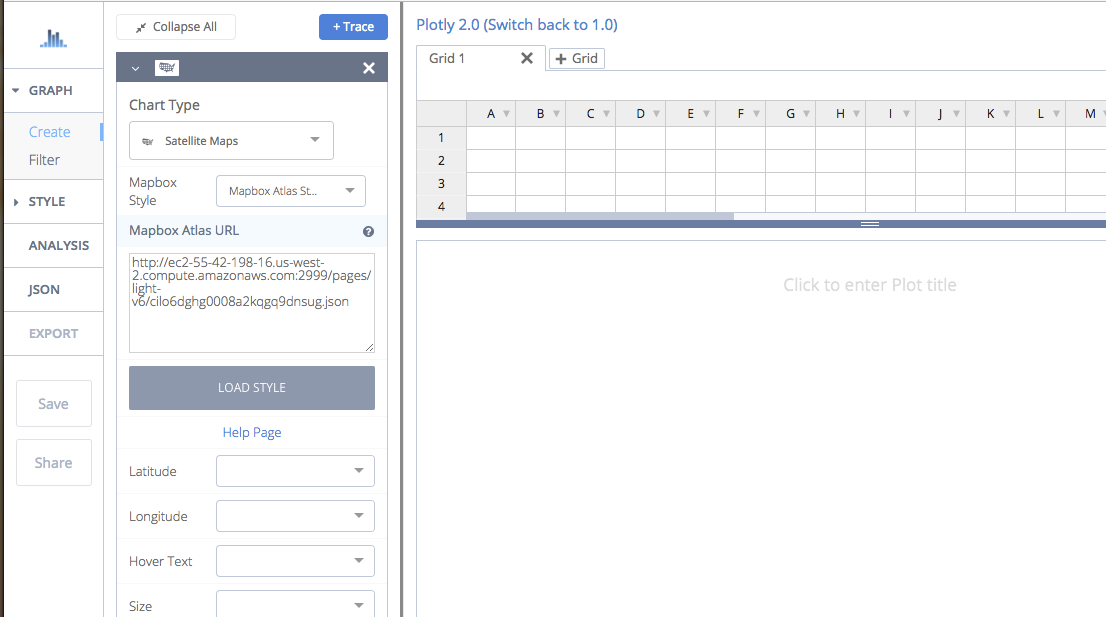
Click on the Load Style button.
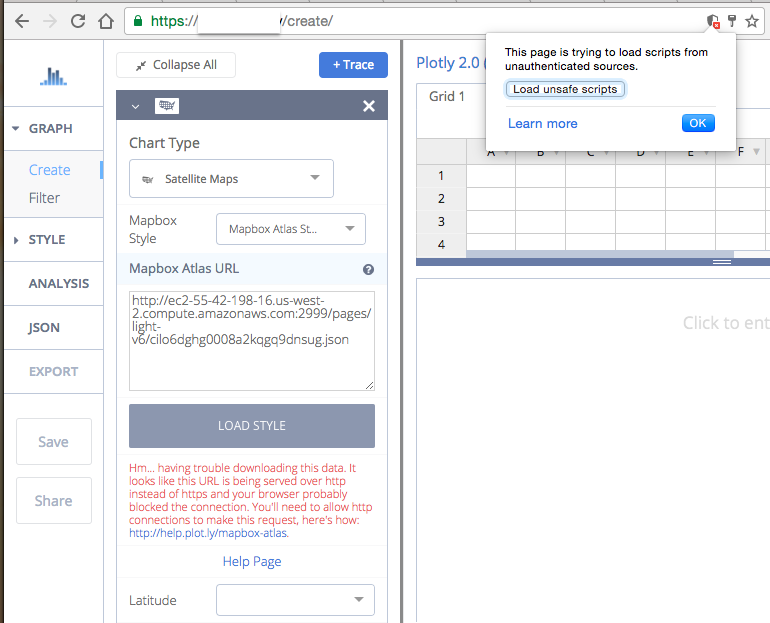
Note: If your Mapbox Atlas server is running on HTTP but your Chart Studio On-Premise server is running on HTTPS, then the browser will initially block the request. You’ll need to click on the Shield icon in the browser’s address bar to allow HTTP requests. The web page will reload.
Once your style has successfully loaded, you’ll see a map like this:
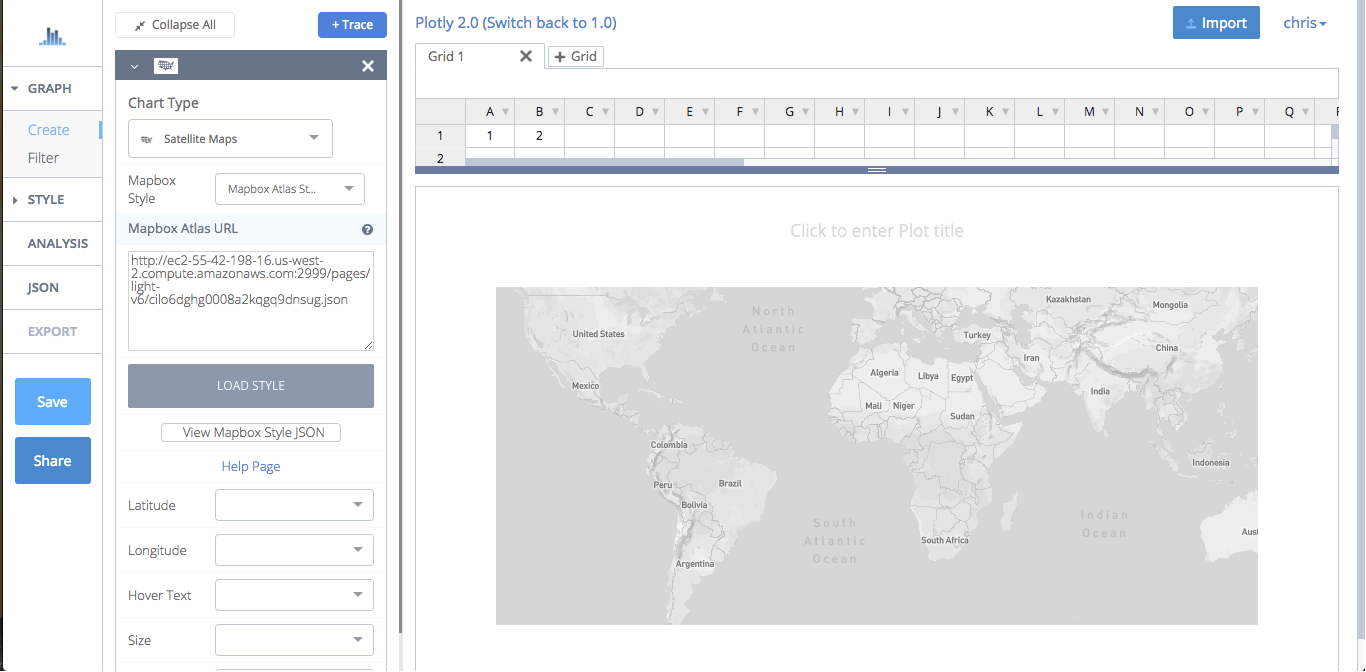
Enter some data, select a latitude and longitude column and make your first chart.
