Visualize Data, Together
Plotly is a data visualization platform for clickers and coders alike.
* Billed annually. Discounted pricing for students and instructors available.
Trusted By


Expressive Charts
Easily turn your data into eye-catching and informative graphics using our sophisticated, open source, visualization library and our online chart creation tool.

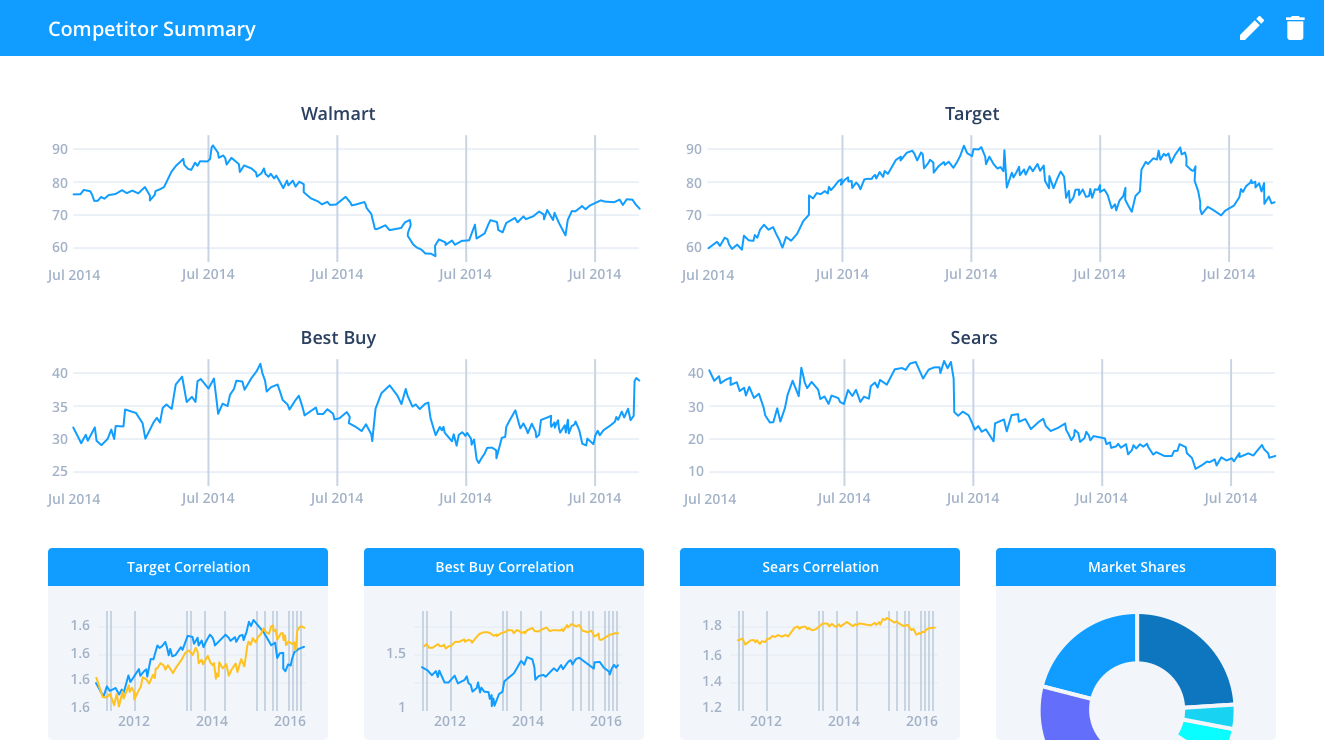
Dazzling Dashboards
These aren’t your dad’s dashboards. Plotly dashboards are web-based, scriptable in Python and R, and feature Plotly’s best-in-class D3 graphics.

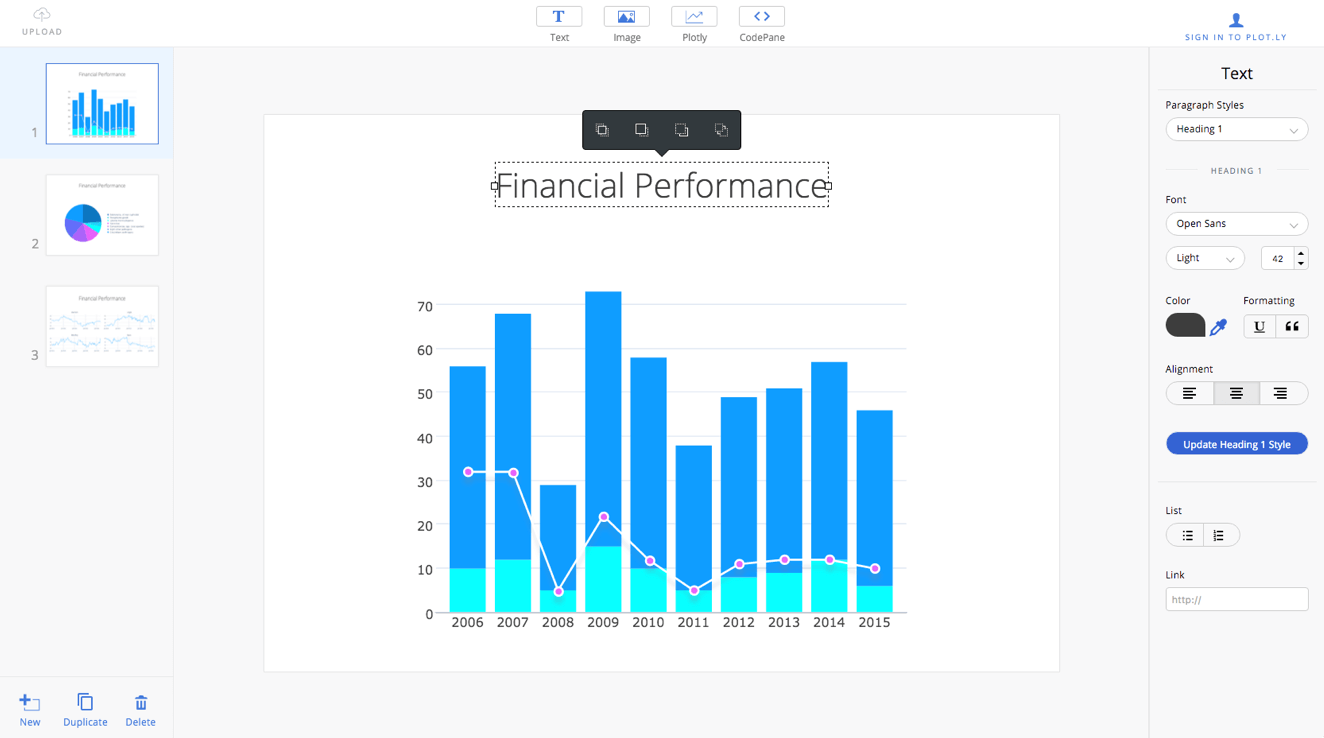
Spectacle Presentations
Create, present, and share slide decks that have interactive Plotly charts. Coders can create presentations in Python and R or clickers can download Spectacle Editor.

Expressive Charts
Easily turn your data into eye-catching and informative graphics using our sophisticated, open source, visualization library and our online chart creation tool.

Dazzling Dashboards
These aren’t your dad’s dashboards. Plotly dashboards are web-based, scriptable in Python and R, and feature Plotly’s best-in-class D3 graphics.

Spectacle Presentations
Create, present, and share slide decks that have interactive Plotly charts. Coders can create presentations in Python and R or clickers can download Spectacle Editor.
in three steps
Import
Create
Share
Connect your data to our platform. Within minutes, start typing SQL.
No database? No problem. We also support csv imports and manual data entry.


Easily create stunning and informative graphics using our sophisticated, open source, visualization library and our online chart creation tool.
Take a look at the chart types that our APIs support and view our community feed.
Easily share your findings by embedding them into a web page, exporting them into pdf, png, svg, eps formats, or creating custom slide decks and dashboards.


Plotly Charts are fundamentally tied to their underlying data.
As charts are shared and data changes hands through your organization, Plotly tracks how that data transforms. Think of it as GitHub for data.
As a cloud platform, Plotly is the only business intelligence solution to provide heavily audited industries with fine-grained information on data provenance.
Plotly's open-source, interactive charting libraries for R, Python, and Javascript are the fastest growing charting libraries in each language. Work entirely offline in IDEs like RStudio or Jupyter notebook, or optionally host your work on Plotly Cloud or Plotly On-Premise. Hosting Plotly charts online allows developers and data scientists to collaborate effortlessly with analysts who do not code.
1 2 3 4 5 6 7 8 9 10 11 12colors=['rgb(53,195,176)', 'rgb(168,201,121)', 'rgb(255,210,181)', 'rgb(255,169,164)', 'rgb(255,140,148)'] points=points_sphere(N=100) data2=get_data(points, R=1.005, arcs=False, colorscale=[], colors=colors) fig2 = Figure(data=data2, layout=plot_layout(ax=noaxis)) fig2['layout'].update(title='Polyhedral approximation of a spherical Voronoi diagram') py.iplot(fig2, filename='polyhedral-voronoi')
Before Plotly, we were entangled in an enterprise BI quagmire. Our system was large, expensive to maintain in both time and effort, and slow to adapt to our fast-changing needs. Plotly was the 'big BI' killer we had been waiting for.
Plotly is at the center of our business development platform, and serves as a starting point for modeling and fitting tools. We can quickly comprehend and analyze huge amounts of data, and use the results to make multi-million-dollar investment decisions.
